Weighted Image and Contrast
(images source: Diagnostic studies in neurology)
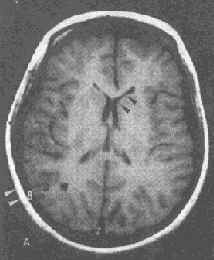 |
- intensity: Fat>WM>GM>CSF>air |
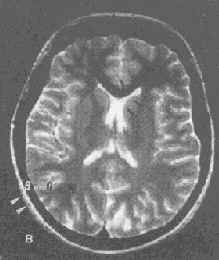 |
| T2 Weighted Image (T2WI) - intensity : CSF>GM>WM>Muscle>air |
||
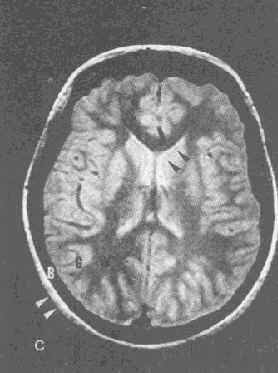 |
- higher signal intensity appears with higher tissue density - intensity: GM>WM |
|